 This report is the fourth in the Location of Development series of research examining the location of approved planning applications for major residential developments across England. Using new data sources, this research seeks to explore access to a range of key destinations that represent local services and community facilities from new developments.
You can download the report here or read in full below:
The Royal Town Planning Institute (RTPI)
The RTPI champions the power of planning in creating prosperous places and vibrant communities. We have over 27,000 members in the private, public, academic and voluntary sectors. Using our expertise and research we bring evidence and thought leadership to shape planning policies and thinking, putting the profession at the heart of society's big debates. We set the standards of planning education and professional behaviour that give our members, wherever they work in the world, a unique ability to meet complex economic, social and environmental challenges. We are the only body in the United Kingdom that confers Chartered status to planners, the highest professional qualification sought after by employers in both private and public sectors.
Land Technologies (LandTech)
LandTech Ltd provides businesses with a data-driven platform to help property developers in the UK find and develop land. Their platform, LandInsight, aggregates data from a variety of sources to provide developers with a comprehensive view of the land market. LandTech also conducts research on the property development industry to help their customers make informed decisions.
About this paper
This paper is the fourth instalment in the RTPI’s Location of Development series, which looks at where housing is planned in England. Using data on planning permissions from LandTech and journey time estimates from the Department for Transport, we look at housing developments that were granted planning permission over the period 2012-2021 to compare the extent they might deliver better access to a range of key destinations that represent local services and community facilities.
Acknowledgments
- Gábor Csontos, Royal Town Planning Institute, for research and analysis throughout the report.
- Harry Quartermain MRTPI, LandTech, for research and analysis throughout the report.
- Dr Jon Reades, Centre for Advanced Spatial Analysis, University College London, for technical insights.
Contents
The purpose of Location of Development
General accessibility of destinations
Settlement form and accessibility
The appeal of sustainable transport
Implications for national planning policy
This paper was published on the RTPI website in October 2024. It was updated in February 2025 to correct minor errors in the figures listed under ‘Key Findings’ p.4 bullet point #5. This correction does not affect the substantive findings of the paper.
1 Executive summary
The purpose of Location of Development
As the professional body of town planners, the RTPI provides data and insight into macro trends affecting planning and development in the United Kingdom. The Location of Development series has been published by the RTPI since 2016. The goal of the series is to use data and analysis to see where new housing developments receive planning permission in England. This has helped policymakers and practitioners understand not just how many homes are approved but also whether they are in the right places.
Each instalment of The Location of Development has increased in scope and ambition. Starting with the analysis of 12 city-regions in 2016, this fourth report now covers nearly 1.6 million homes in major residential developments in England over the period 2012-2021 and builds on the findings and conclusions from the previous three reports. We partnered with LandTech for the second time, who provided access to the database of planning permissions that informs their LandInsight product, which the RTPI synthesised with the Department for Transport’s journey time model and the Office for National Statistics’ Rural-Urban Classification information.
As indicated throughout the Location of Development series, national planning policy in England sets a strategic direction: to support economic growth, the vitality of town centres, the health and wellbeing of residents and to encourage sustainable transport, in large part by being directed to the right locations. The analysis in this report can inform understanding of the extent to which there have been improvements in these areas over the study period.
Key findings
Our key findings show that over the study period (2012 to 2021):
- Accessibility of destinations from approved new homes remained broadly constant. Newly approved housing developments were similar to the existing housing stock in their journey times to destinations.
- There were inequalities between regions and between urban and rural areas. Approved homes in London were the most accessible while those in the South West and East of England are the least accessible.
- There was little or no improvement in the take up of public transport over the option of driving to local facilities from newly approved homes. The car as a mode of transport was 1.5 times faster nationally to reach key destinations from residential development, including 2 times faster to reach hospitals.
- Cycling was a competitive alternative to driving by car, taking nationally only 1.3 times as long to reach key destinations from approved new homes.
- The majority of new homes were approved within walking distance of a GP (79%) and a primary school (95%). 39% were within a 20 minute walk to large employment centres with at least 5,000 jobs and 47% to a town centre.
Why does this matter
The RTPI has previously found that the relationship between settlement patterns, urban form and sustainability[1] is important for a number of reasons, including:
- Large and compact settlement patterns support economic productivity by reducing the distances between homes and jobs and making efficient use of infrastructure networks.
- Settlement patterns and urban forms that promote sustainable mobility play a critical role in reducing transport emissions, with larger settlements, higher densities and mixed land uses reducing the need to travel by car.
- Larger settlements with higher densities and mixed land use improves public health by increasing physical activity, which helps to address the prevalence, severity and cost of chronic lifestyle-related diseases.
- Compact, medium density, mixed use and public-transport friendly settlements can encourage continued physical activity, economic participation and social interaction for an ageing population.
2 Introduction
Planning practitioners and academics acknowledge there is widespread public interest in the volume of new housing in England, and across the UK.[2] It continues to be important to consider not just whether enough homes are built, but also whether they are built in the right places. Research has already shown that the location and spatial pattern of development influences health outcomes, the use of active travel and public transportation, and other measures of wellbeing.[3]
The RTPI’s Location of Development is a series of research papers on planning practice focused on where residential developments are granted planning permission across England. So far, the RTPI has published three instalments.
- The original Location of Development (2016) focused on planning permissions in 12 English city-regions in the period 2012-2015.
- The second Location of Development (2018) repeated this for the period 2012-2017. It was accompanied by the research paper ‘Settlement Patterns, Urban Form and Sustainability’ which served as its theoretical background.
- The third Location of Development (2021) focused on the entirety of England between 2015-2019 and utilised LandTech’s database and the Department for Transport’s journey time data to assess the accessibility of destinations from planned major developments.
In this fourth iteration of Location of Development a similar methodology to the third report has been used, by synthesising LandTech and Department for Transport data and expanding the scope to cover the period 2012-2021. This report crucially studies the location of 1.6 million homes across over 16,000 major developments and therefore is a composite and comprehensive longitudinal analysis of sustainable transport and the location of approved residential developments over that period. The findings provide valuable information and data to consider how the location of approved residential developments measure up in encouraging sustainable land use and transportation since 2012.
Following this introduction, the methodological approach and datasets are set out in section 3. The key findings on the location of development, including implications for national policy, are set out in section 4 and then conclusions from the analysis and suggestions for further research are set out in section 5.
3 Method
Research question and definitions
The research tackled the following question:
What are the patterns in the accessibility of key destinations from approved residential developments in the period 2012-2021?
The approach first combined data held by LandTech with Department for Transport (DfT) journey time statistics and the Office for National Statistics (ONS) Rural-Urban Classification (RUC) to create a model of the location of approved residential developments over the study period. Analysis of this model dataset generated key trends and relationships for the study period.
Key destinations are the amenities and facilities from the DfT data included for analysis, namely; large employment centres, town centres, primary schools, secondary schools, GPs and hospitals.
An approved new residential development is a development comprising of multiple housing units in the dataset that received planning permission. An approved new home is a single housing unit in the dataset that received planning permission.
For the purposes of the research analysis, the established terms major development (i.e. a residential development with at least 10 homes, or at least 0.5 acres in area); and sustainable transport (i.e. cycling, walking and public transport modes), have been used.
Data and analysis
The research has synthesised information from the LandInsight database, DfT journey time statistics, and the ONS Rural-Urban Classification.
LandTech LandInsight
LandInsight is designed to help ‘property professionals find and assess more sites, prepare [their] sites for funding and manage [their] pipeline better [and] faster’.[4] It features data on land ownership, power infrastructure, planning and policy from a variety of data sources. The database contains planning data from local authorities and government, including development size, date of planning permission and location.
From this database a dataset was created with the following cross-comparable dimensions: Lower layer Super Output Area (LSOA)[5],[6]; Year; Number of approved major developments i.e. >9 homes; Number of approved dwellings within these developments; Rural-Urban Classification.

Overall, the data included around 915,000 homes in over 16,000 major developments. Comparing with data published by DLUHC[7] (originally collected by Glenigan), this suggests that one-third of all homes that were granted planning permission in the study period are included for analysis.

Figure 1: Number of approved new homes within the dataset used, aggregated by region
As indicated by Figure 1, most of the approved homes in our dataset were located in London (191,249), the North West (155,215) and the south East (122,864), while the fewest were in the North East (50,386), the East Midlands (69,190) and the West Midlands (75,400) (see Figure 2). Just under 779,000 or 85% of the approved homes were in urban areas and around 137,000 or 15% of the approved homes were in rural areas.
Department for Transport journey time statistics
The Department for Transport's (DfT) journey time statistics[8] provide an overview of travel times across England for various modes of transport and purposes of travel. For any given Lower Super-Output Area (roughly, the area of a neighbourhood) they provide estimates for peak journey times by a variety of modes of transport to a range of destinations.
The modes of transport studied are:
- Walking
- Cycling
- Public transport
- Driving
Within this report the following definitions are used:
- ‘all transport modes’ to mean all four transport modes in the study
- ‘sustainable transport’ to mean walk, cycle and public transport
- ‘active transport’ to mean walk and cycle.
The ‘destinations’ are:
- Large employment centres (individual output areas with at least 5,000 jobs)
- Primary and secondary schools
- GPs and hospitals
- Town centres
The DfT generates these statistics using a combination of spatial data on transport networks, service locations, and population distribution, coupled with assumptions regarding travel speeds and patterns. The evidence base for the journey time statistics is drawn from a variety of sources, including public transport timetables, road network data, cycle and footpath network data, population census data and service location data.
The DfT publishes metadata on the number of destinations of various types included in their dataset and Table 1 shows a series of changes over the 2014-2019 period. The number of employment centres and primary schools increased, whereas secondary schools and the provision of medical centres (GPs and hospitals) declined. The number of town centre destinations remained constant.
Table 1: The number of key services in the DfT journey time model by year (adapted from DfT documentation)
|
Key service |
2014 |
2015 |
2016 |
2017 |
2019 |
|
Large employment centres |
645 |
676 |
719 |
785 |
843 |
|
Primary schools |
16,463 |
16,484 |
16,655 |
16,927 |
16,948 |
|
Secondary schools |
3,365 |
3,376 |
3,381 |
3,174 |
3,128 |
|
GPs |
9,257 |
11,167 |
9,128 |
7,353 |
6,866 |
|
Hospitals |
296 |
278 |
278 |
277 |
219 |
|
Town centres |
1,211 |
1,211 |
1,211 |
1,211 |
1,211 |
These sources provide a robust foundation for estimating journey times, but there are some limitations[9]. There is only data for five years in the period 2014-2019 however the latest DfT (2019) statistics for journey times to destinations were assumed fixed throughout the period covered in research (2012-2021). This allows for a more consistent comparison of locational improvement and was reasonable given that the same statistics were not available for the entire study period.
Rural-Urban Classification
The Rural-Urban Classification (RUC) for England takes a systematic approach to categorizing small-scale areas based on their level of urbanisation.[10] This classification scheme is primarily grounded in population density and settlement characteristics.
It groups Output Areas into ten categories, in increasing order of urbanity:
- Rural:
- Hamlets and Isolated Dwellings
- Hamlets and Isolated Dwellings in a sparse setting
- Village
- Village in a sparse setting
- Town and Fringe
- Town and Fringe in a sparse setting
- Urban:
- City and Town
- City and Town in a sparse setting
- Minor Conurbation
- Major Conurbation
For the purposes of this report, we merged the ten categories of the RUC into just two: rural and urban. This helped filter out sample size anomalies caused by smaller groupings and allowed us to see the broader split between urban and rural areas.
4 Findings
General accessibility of destinations

Figure 2: Average journey times in minutes for the transport options used within the dataset
There is no evidence of a reduction in journey times from newly approved homes to key destinations. When averaged across England, journey times measured in minutes remain broadly constant for all four modes of transport in the study period. From an approved home it takes an average of 11 minutes to drive, 15 minutes to cycle, 18 minutes to take public transport and 32 minutes to walk to an average of GPs, hospitals, town centres, large employment centres, primary schools and secondary schools.
Comparing these statistics to national averages published alongside the DfT’s data, it seems that approved new homes are at a similar distance from key destinations as the existing housing stock. The overall DfT statistics estimate an average of 10 minutes by car, 16 minutes by cycle, 18 minutes by public transport or walking and 28 minutes by walking only.
GPs and primary schools are the most accessible destinations. On average it takes only 9 minutes to reach a primary school and 11 minutes to reach a GP. This is followed by secondary schools (16 min), town centres (19 min) and large employment centres (21 min). The furthest destination is hospitals (38 min). Primary schools and GPs are accessible within a 15 minute walk, and all destinations other than hospitals can be reached within 30 minutes by public transport.
Table 2: Average travel times (minutes) from the average of all approved new homes in the study to all destinations by transport type
|
|
|
|
|
|
Average |
|
GP |
8 |
10 |
12 |
15 |
11 |
|
Hospital |
18 |
32 |
37 |
64 |
38 |
|
Town centre |
11 |
16 |
18 |
31 |
19 |
|
Large employment centre |
12 |
12 |
14 |
45 |
21 |
|
Primary school |
7 |
9 |
9 |
10 |
9 |
|
Secondary school |
10 |
14 |
17 |
24 |
16 |
|
Average |
11 |
15 |
18 |
32 |
19 |
Regionally across England, approved homes in London had the shortest journey times to all destinations by all modes of transport at 12 minutes on average. The South West and the East of England approved new homes furthest from destinations (26 and 28 minutes), with the rest of the regions in a close cohort in between (16-21 minutes). On average, one can expect to walk over 2.5 times as far to the average destination from an approved home in the East of England than in London.
Table 3: Regional averages of travel times to destinations (minutes) from all approved new homes in the study
|
|
|
|
|
|
Average |
|
East Midlands |
12 |
17 |
19 |
37 |
21 |
|
East of England |
14 |
23 |
25 |
49 |
28 |
|
London |
8 |
10 |
12 |
18 |
12 |
|
North East |
12 |
17 |
19 |
37 |
21 |
|
North West |
10 |
13 |
16 |
25 |
16 |
|
South East |
12 |
18 |
21 |
40 |
23 |
|
South West |
13 |
22 |
23 |
45 |
26 |
|
West Midlands |
11 |
15 |
17 |
29 |
18 |
|
Yorkshire and The Humber |
11 |
14 |
17 |
29 |
18 |
|
England average |
11 |
16 |
18 |
32 |
19 |
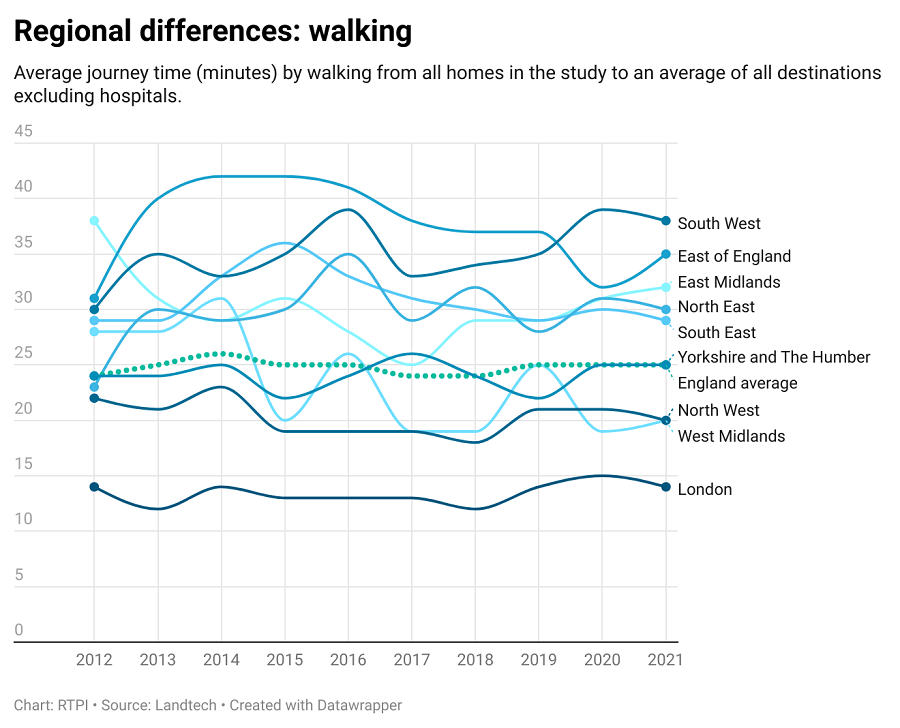
Figure 3: Average walking times (minutes) per region over the study period
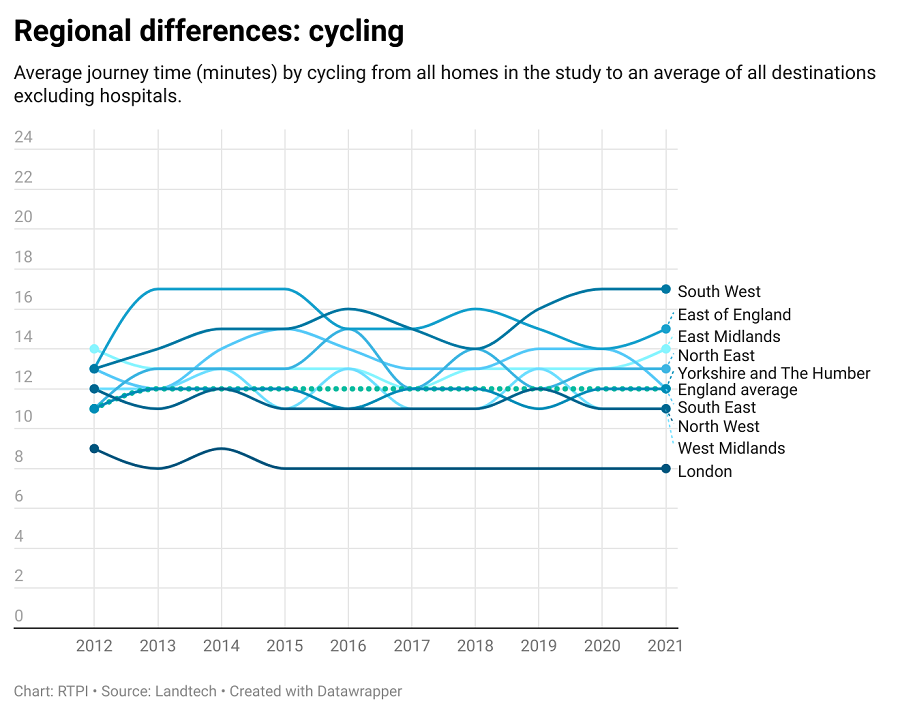
Figure 4: Average cycling journey times (minutes) per region over the study period
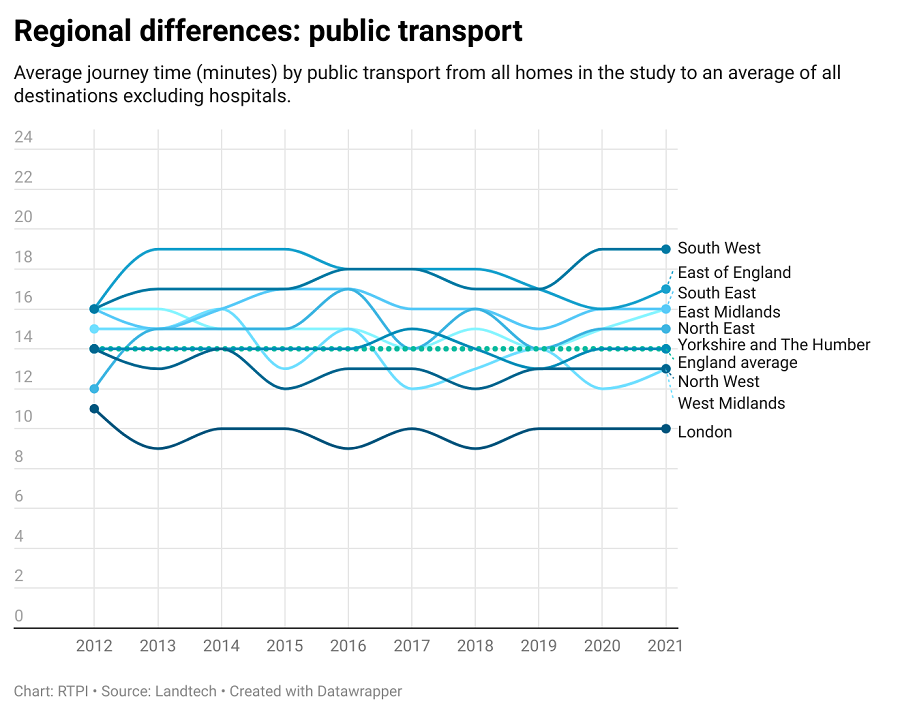
Figure 5: Average public transport journey times (minutes) per region over the study period
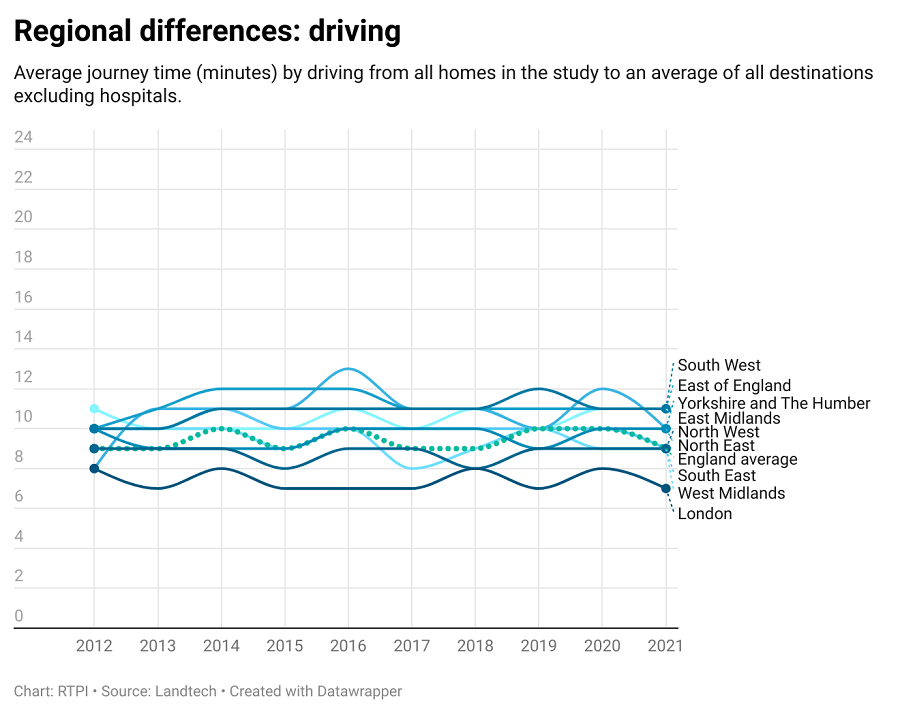
Figure 6: Average car journey times (minutes) per region over the study period
Settlement form and accessibility
Accessibility of destinations located in rural areas is significantly lower compared to urban areas. For example, as shown in Table 4, while 87% of approved new homes in urban developments can access a GP within 20 minutes on foot, only 36% of new residential developments in rural areas can. Almost half of approved new homes in urban developments (46%) can access a large employment centre within a 20 minute walk, but only 1% for those located in rural developments.
Table 4: Proportion of all approved homes in the study within a 20 minute walk to key destinations and local services
|
GP |
Hospital |
Large employment centre |
Primary school |
Secondary school |
Town centre |
Average |
|
|
Rural |
36% |
0% |
1% |
78% |
17% |
9% |
23% |
|
Urban |
87% |
10% |
46% |
98% |
62% |
53% |
59% |
|
Nationally |
79% |
9% |
39% |
95% |
55% |
47% |
54% |
The discrepancies are less for public transportation, with on average of 82% of homes able to access key destinations within 45 minutes from approved homes in rural areas compared with 97% in urban areas. However, the differences remain significant in the case of hospitals, where only one in four (26%) of approved new homes in rural areas can access them in this timeframe. The calculation for approved new homes in urban areas is much higher, at four in five (84%).
Table 5: Proportion of all approved homes in the study within 45 minutes public transport to key destinations and local services
|
GP |
Hospital |
Large employment centre |
Primary school |
Secondary school |
Town centre |
Average |
|
|
Rural |
95% |
26% |
95% |
100% |
91% |
84% |
82% |
|
Urban |
100% |
84% |
99% |
100% |
100% |
100% |
97% |
|
Nationally |
99% |
75% |
99% |
100% |
99% |
97% |
95% |
Table 6: Average travel times (minutes) to destinations within Rural and Urban areas across all developments in the study
|
|
|
|
|
|
|
Average |
|
All destinations excl. hospitals |
Nationally |
9 |
12 |
14 |
25 |
15 |
|
Rural areas |
15 |
22 |
23 |
56 |
29 |
|
|
Urban areas |
9 |
10 |
12 |
20 |
13 |
|
|
Hospitals |
Nationally |
18 |
32 |
37 |
64 |
38 |
|
Rural areas |
28 |
63 |
62 |
110 |
66 |
|
|
Urban areas |
16 |
27 |
32 |
56 |
33 |
|
|
|
Rural/urban ratio** |
1.7 |
2.1 |
1.9 |
2.9 |
2.3 |
|
|
Rural/urban ratio (hospitals) |
1.7 |
2.4 |
1.9 |
2.0 |
2.0 |
** Travel times in rural areas as a multiple of those in urban areas
Average journey times to key destinations other than hospitals are all within 20 minutes from approved homes in urban areas by all four modes of transport. However, from approved new homes in rural areas, only cars provide 20-minute access to the same destinations. In the case of hospitals, residents of approved urban developments will be able to reach a hospital in 17 minutes by car and a little over 30 minutes by public transport. In contrast, those in rural developments would need to drive for 30 minutes or take public transport for over an hour (65 minutes). This might prove to be an underestimate in due course, as a relatively large percentage of approved homes in rural areas are over 120 minutes away from the nearest hospital.
The appeal of sustainable transport
The data holds some insight into the continued appeal of cars and driving. First, cars were the fastest mode of transport from all developments to all destinations in the vast majority of scenarios. Comparing journey times by public transport and by car reveals that across England it takes 1.5 times as long to get to key destinations by public transport as by driving. Even in London this number is 1.3. Across England, accessing a hospital takes twice as long by public transport as it does by driving (1.8 times in London).
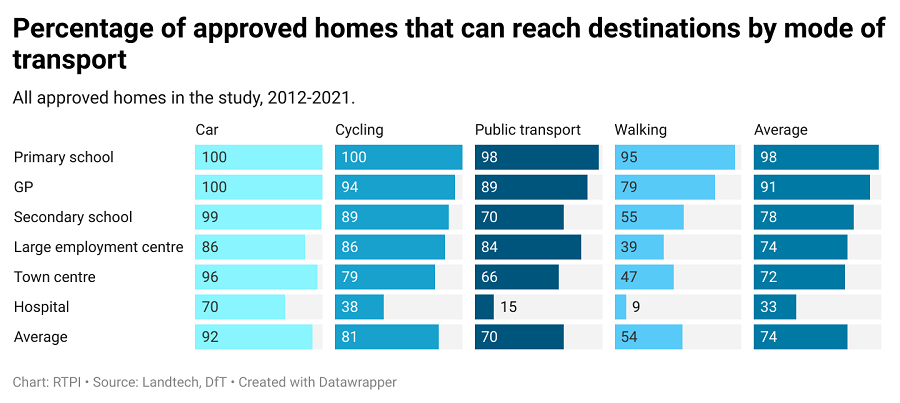
Figure 7: Approved new homes within reach of local services by transport mode
A similar picture emerges with the proportion of homes approved within 20-minute access to destinations (Figure 7). Nationally, 96% of approved homes can reach a town centre with an up to 20-minute drive, but only 66% within a 20-minute journey on public transport, and 47% within a 20-minute walk.
Furthermore, both regional and rural-urban differences are smaller in car journey times than journey times by other modes of transport. For example, the difference between the average journey times of the most and least accessible region (London and the South West) is 4 minutes (8 vs 12 minutes) in the case of car, and 10 minutes (10 vs 20 minutes) in the case of public transport.
This suggests that the car has an ‘equalising effect’ allowing individuals and families to look for housing further away from expensive urban areas and the vicinity of train stations. This result is in line with earlier research[11], including that by the RTPI[12]. Incentivising a shift to sustainable transport modes could involve a mix of policy responses, including:
- the extension of sustainable transport infrastructure to close regional and rural-urban gaps in accessibility;
- releasing development sites close to existing public transport infrastructure such as train and tube stations for redevelopment;
- further financial ‘disincentives’ to car use, such as higher parking fees or additional ‘congestion zone’ pricing.
Active travel and walkability
A commonly used benchmark for walkability is the accessibility of destinations within a 15- or 20-minute walk.[13] This report measures the proportion of approved dwellings that fell within this threshold for a variety of destinations over the aggregate of the study period, and also to study temporal trends.
Over time, there has been little change in the percentage of approved new homes within walking distance to destinations. There is also little change in average journey times from approved homes to key destinations by cycling and walking. In the study period and in England as a whole, 93% of approved developments can access a primary school, 75% a GP, 54% a secondary school, 46% a town centre and 32% a large employment centre on foot.
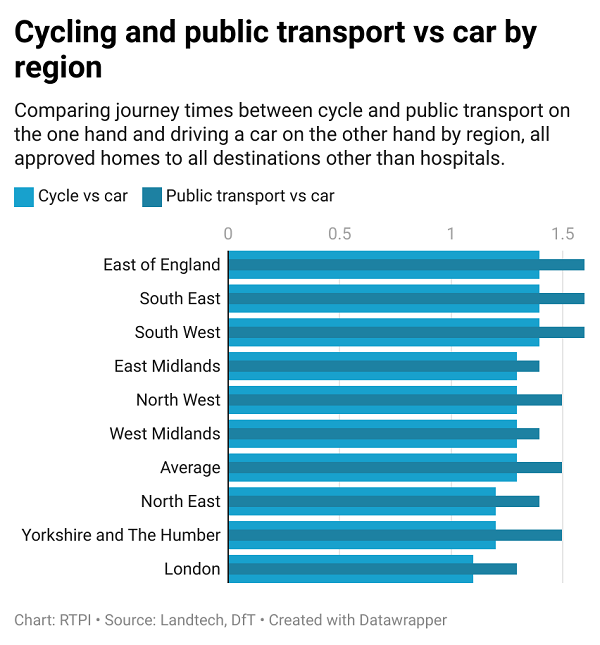
Figure 8: Comparison of cycle and public transport versus car journey times, by region
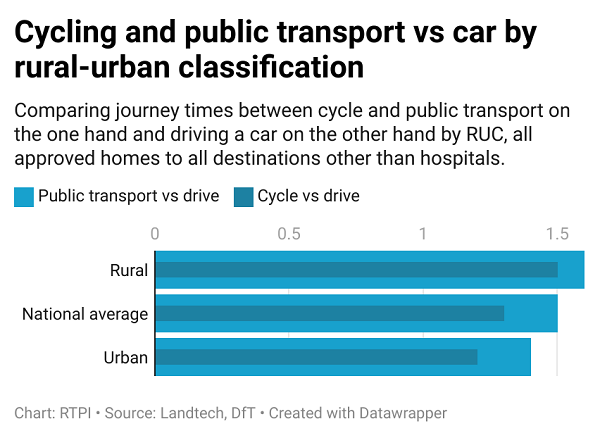
Figure 9: Comparison of cycle and public transport versus car journey times within Rural and Urban areas
The findings show that cycling is a competitive alternative to car use in most new developments studied. Across England it took only 1.3 times as long to cycle to the average of destinations (apart from hospitals) as it did to drive, compared to 1.5 times for public transport vs driving. While cycling is not accessible to everyone (for example, very young children or those with disabilities), the results highlight the feasibility of enabling it as a mode of transport to as large a population as possible.
Implications for national planning policy
Previous Location of Development reports noted the relevance of the study series to several national planning policy objectives.[14] With the inclusion of time series data it is possible to reflect on the progress made in these areas as summed up in the Table 7.
In general, the data shows little change (either positive or negative) when it comes to these policy objectives over the study period.
Table 7: Summary of findings to relevant national planning policy objectives
|
Policy objective |
Relevant data |
Findings |
|
Building a strong, competitive economy and supporting a prosperous rural economy
|
Proximity of approved homes to employment centres and education facilities. Accessibility of destinations from rural locations. |
There is good access to primary schools by all means of transport, but there is no improvement in access to secondary schools or employment centres. There are differences in access to sustainable transport between rural and urban developments. |
|
|
Proximity of approved homes to town centres. |
47% of approved homes can access a town centre within 20 minutes on foot, and nearly all by car, but this has not improved in the study period. |
|
|
Proximity of approved homes to healthcare facilities. Opportunity to access destinations by active travel (walking and cycling). |
There are no signs of major changes to access to healthcare from developments granted permission; especially rural access to hospitals remains problematic. Active travel is a promising alternative to driving – cycling to key destinations only takes 1.2 times as long as driving nationally. |
|
|
Competitiveness of sustainable transport options (walking, cycling and public transport) with driving. |
From new developments it takes 1.5 times as long to take public transport to key destinations as it does to drive, and twice as long for hospitals. This indicates no improvement in this over the study period. |
|
|
General proximity of approved homes to destinations. |
Between 2019 and 2021 we see developments approved further away from all destinations by all four transport modes. |
5 Conclusion
Purpose and methodology
This report focuses on sustainable travel and the location of residential planning permissions. It has identified patterns in the accessibility of destinations from new residential developments in the period 2012-2021 in England.
The findings are a result of data held by LandTech combined with the Department for Transport (DfT) journey time statistics and the ONS’s rural-urban classification (RUC) to create a model of the location of approved housing developments over the study period. Insights can be gained into both the volume and the location of new housing developments.
Findings
General trends
There have been no significant changes over the ten-year study period in journey times to destinations from newly approved developments. GPs and primary schools are the most accessible destinations, with secondary schools, town centres and employment centres further away, and hospitals the least accessible to new homes. Driving is the fastest mode of transport, followed by cycling, public transport and walking.
Regional and rural-urban inequality
As with earlier Location of Development reports, access to amenities remains unequal[15]. When comparing different regions’ access local services, residents of newly approved developments have the shortest journeys in London. Residents in the South West and the East of England have the longest journey times. There are inequalities between rural and urban areas – journey times from new rural developments are twice as long as their urban counterparts.
Implications for sustainable development
This research fills an important purpose in the policy landscape – measuring not just how many homes are given planning permission, but also whether they are in locations that incentivise sustainable transport. It would seem that over the study period, there has been little to no improvement following analysis of the metrics available on sustainable transport and the location of residential planning permissions - that is, new homes approved at the end of the study period 2012-21 are not in closer proximity to key destinations than those developments approved near the beginning.
Future directions
Other nations
Currently the RTPI Location of Development series covers England. In the future the geographic scope could be expanded to other RTPI nations (for example Scotland, Northern Ireland, Wales and Ireland) but this is constrained by the availability and consistency of data. More robust models of location, settlement type, connectivity and the availability of destinations over time would allow a more detailed appraisal of the performance of these planning systems.
Aggregation of open data
The monitoring of housing land availability by local authorities has encountered various challenges in recent years, including insufficient resourcing. A number of assumptions have been made to reach conclusions where gaps in data were evident. The Planning London Datahub[16] is one example of aggregating data from different sources in a clear manner.
Further support from national and local governments, as part of a digital planning investment strategy, is necessary; in collecting and openly sharing up-to-date, standardised and reliable data on planning outcomes and related matters across the natural and built environment, including housing standards and design quality.
References
Badland, Hannah, Marcus White, Gus MacAulay, Serryn Eagleson, Suzanne Mavoa, Christopher Pettit, and Billie Giles-Corti. “Using Simple Agent-Based Modeling to Inform and Enhance Neighborhood Walkability.” International Journal of Health Geographics 12, no. 1 (December 11, 2013): 58. https://doi.org/10.1186/1476-072X-12-58.
Boggis, Mark. “New 1,300 Home Garden Village and Major Developments Earmarked.” Lowestoft Journal, August 29, 2022. https://www.lowestoftjournal.co.uk/news/business/20820853.new-1-300-home-garden-village-major-developments-earmarked/.
Bolton, Tom, Francesca Froy, Sadaf Sultan Khan, and Nicholas Francis. “Health Policy and Place Layout.” University College London, 2017. https://spacesyntax.com/wp-content/uploads/2018/03/2.-Health-policy-and-place-layout_2018.pdf.
Cao, Mengqiu, and Robin Hickman. “Car Dependence and Housing Affordability: An Emerging Social Deprivation Issue in London?” Urban Studies 55, no. 10 (August 2018): 2088–2105. https://doi.org/10.1177/0042098017712682.
Carmichael, Laurence, Tim G. Townshend, Thomas B. Fischer, Karen Lock, Carl Petrokofsky, Adam Sheppard, David Sweeting, and Flora Ogilvie. “Urban Planning as an Enabler of Urban Health: Challenges and Good Practice in England Following the 2012 Planning and Public Health Reforms.” Land Use Policy 84 (May 1, 2019): 154–62. https://doi.org/10.1016/j.landusepol.2019.02.043.
Carter Jonas. “The Future of National Housing Targets,” 2024. https://www.carterjonas.co.uk/planning-development-insite/national-housing-targets-future.
Chartered Institute of Building. “Home Is Where the Vote Is: Will the Housing Crisis Determine the next Election?” Politics Home, October 17, 2023. https://www.politicshome.com/members/article/home-vote-is-housing-crisis-determine-next-election.
Department for Environment, Food & Rural Affairs. “Rural Urban Classification.” GOV.UK, August 26, 2021. https://www.gov.uk/government/collections/rural-urban-classification.
Department for Transport. “Journey Time Statistics, England: 2019.” GOV.UK, 2019. https://www.gov.uk/government/statistics/journey-time-statistics-england-2019.
———. “Journey Time Statistics, Notes and Definitions: 2019.” GOV.UK, 2019. https://www.gov.uk/government/publications/journey-time-statistics-guidance/journey-time-statistics-notes-and-definitions-2019.
Earth, Matthew. “Suffolk: The Large Housing Developments Approved in 2022.” East Anglian Daily Times, December 24, 2022. https://www.eadt.co.uk/news/23212598.suffolk-large-housing-developments-approved-2022/.
Giles‐Corti, Billie, Gus Macaulay, Nick Middleton, Bryan Boruff, Fiona Bull, Iain Butterworth, Hannah Badland, Suzanne Mavoa, Rebecca Roberts, and Hayley Christian. “Developing a Research and Practice Tool to Measure Walkability: A Demonstration Project.” Health Promotion Journal of Australia 25, no. 3 (December 2014): 160–66. https://doi.org/10.1071/HE14050.
Land Technologies. “LandInsight,” 2024. https://land.tech/products/landinsight.
London City Hall. “The Planning London Datahub,” 2024. https://www.london.gov.uk/programmes-strategies/planning/digital-planning/planning-london-datahub.
Office for National Statistics. “Census 2021 Geographies,” 2021. https://www.ons.gov.uk/methodology/geography/ukgeographies/censusgeographies/census2021geographies.
———. “Public Opinions and Social Trends, Great Britain: 11 to 22 January 2023,” January 27, 2023. https://www.ons.gov.uk/peoplepopulationandcommunity/wellbeing/bulletins/publicopinionsandsocialtrendsgreatbritain/11to22january2023#cite-this-statistical-bulletin.
Property Reporter. “Younger Generation More Likely to Vote If a Party Proposes to Address Housing Affordability.” Property Reporter, May 18, 2023. https://www.propertyreporter.co.uk/younger-generation-more-likely-to-vote-if-a-party-proposes-to-address-housing-affordability.html.
Reiter, Aiden, Cara Murray, and Joshua Oliver. “How Many Homes Does England Really Need to Build?” Financial Times, February 21, 2024. https://www.ft.com/content/32846f68-52fd-40e1-9328-0fe6bb3b9c19.
Royal Town Planning Institute. “Location of Development,” 2016. https://www.richborough.co.uk/wp-content/uploads/2019/07/104a.pdf.
———. “Location of Development,” May 16, 2018. https://www.rtpi.org.uk/research/2020/january/location-of-development/.
———. “Measuring What Matters,” 2020.
———. “Settlement Patterns, Urban Form and Sustainability,” May 2018. https://www.rtpi.org.uk/research/2018/may/settlement-patterns-urban-form-and-sustainability/.
———. “The Location of Development,” December 2021. https://www.rtpi.org.uk/research/2021/december/the-location-of-development/.
Smith, Fintan. “Most Britons Would like Their Area to Become a ‘15-Minute Neighbourhood’.” YouGov (blog), March 6, 2023. https://yougov.co.uk/society/articles/45347-most-britons-would-their-area-become-15-minute-nei.
Town and Country Planning Association. “The 20-Minute Neighbourhood.” Town and Country Planning Association (blog), September 14, 2023. https://www.tcpa.org.uk/collection/the-20-minute-neighbourhood/.
Zuniga-Teran, Adriana A., Barron J. Orr, Randy H. Gimblett, Nader V. Chalfoun, David P. Guertin, and Stuart E. Marsh. “Neighborhood Design, Physical Activity, and Wellbeing: Applying the Walkability Model.” International Journal of Environmental Research and Public Health 14, no. 1 (2017): 76.
[1] Royal Town Planning Institute, “Settlement Patterns, Urban Form and Sustainability,” May 2018, https://www.rtpi.org.uk/research/2018/may/settlement-patterns-urban-form-and-sustainability/.
[2] Carter Jonas, “The Future of National Housing Targets,” 2024, https://www.carterjonas.co.uk/planning-development-insite/national-housing-targets-future.
[3] Tom Bolton et al., “Health Policy and Place Layout” (University College London, 2017), https://spacesyntax.com/wp-content/uploads/2018/03/2.-Health-policy-and-place-layout_2018.pdf; Royal Town Planning Institute, “Settlement Patterns, Urban Form and Sustainability”; Adriana A. Zuniga-Teran et al., “Neighborhood Design, Physical Activity, and Wellbeing: Applying the Walkability Model,” International Journal of Environmental Research and Public Health 14, no. 1 (2017): 76; Laurence Carmichael et al., “Urban Planning as an Enabler of Urban Health: Challenges and Good Practice in England Following the 2012 Planning and Public Health Reforms,” Land Use Policy 84 (May 1, 2019): 154–62, https://doi.org/10.1016/j.landusepol.2019.02.043.
[4] Land Technologies, “LandInsight,” 2024, https://land.tech/products/landinsight.
[5] The LSOA is the national statistical area comprising between 400 and 1,200 households and have a usually resident population between 1,000 and 3,000 persons.
[6] Office for National Statistics, “Census 2021 Geographies,” 2021, https://www.ons.gov.uk/methodology/geography/ukgeographies/censusgeographies/census2021geographies.
[7] The study covers the highest number of approved homes in 2018 (111,613), and the lowest number in 2012 (35,192). The general trajectory follows that of total DLUHC estimates of approvals, which peaked in 2019 and were the lowest in 2012 within the study period.
[8] Department for Transport, “Journey Time Statistics, England: 2019,” GOV.UK, 2019, https://www.gov.uk/government/statistics/journey-time-statistics-england-2019; Department for Transport, “Journey Time Statistics, Notes and Definitions: 2019,” GOV.UK, 2019, https://www.gov.uk/government/publications/journey-time-statistics-guidance/journey-time-statistics-notes-and-definitions-2019.
[9] The model seeks to provide an estimate for an average peak hour for traffic speed, but considerable variation throughout different times of the year and day occurs. The model's reliance on default assumptions for cycling and walking speeds introduces an element of uncertainty into the calculations for this mode of transport. Unfortunately the dataset cannot consider common combined modes of travel (e.g. taking a car trip to the nearest train station, or cycling to/from the nearest Tube stop with a foldable bike). The researchers are also aware that the DfT model does not different between journeys over 2 hours, and marks these as taking 120 minutes. However this only affects 1.7% of possible development-transport mode-destination variations (0.9% in urban and 6.2% in rural areas).
[10] Department for Environment, Food & Rural Affairs, “Rural Urban Classification,” GOV.UK, August 26, 2021, https://www.gov.uk/government/collections/rural-urban-classification.
[11] Mengqiu Cao and Robin Hickman, “Car Dependence and Housing Affordability: An Emerging Social Deprivation Issue in London?,” Urban Studies 55, no. 10 (August 2018): 2088–2105, https://doi.org/10.1177/0042098017712682.
[12] Royal Town Planning Institute, “The Location of Development.”
[13] Billie Giles‐Corti et al., “Developing a Research and Practice Tool to Measure Walkability: A Demonstration Project,” Health Promotion Journal of Australia 25, no. 3 (December 2014): 160–66, https://doi.org/10.1071/HE14050; Hannah Badland et al., “Using Simple Agent-Based Modeling to Inform and Enhance Neighborhood Walkability,” International Journal of Health Geographics 12, no. 1 (December 11, 2013): 58, https://doi.org/10.1186/1476-072X-12-58.
[14] Royal Town Planning Institute, “The Location of Development.”
[15] Royal Town Planning Institute, “The Location of Development,” December 2021. https://www.rtpi.org.uk/research/2021/december/the-location-of-development/.
[16] London City Hall, “The Planning London Datahub,” 2024, https://www.london.gov.uk/programmes-strategies/planning/digital-planning/planning-london-datahub.

 Ensuring the vitality of town centres
 Promoting healthy communities
 Promoting sustainable transport
 Making effective use of land

